Instrument control package
Instrument-Control is a package for interfacing the outside world of hardware via Serial, i2c or Parallel interfaces. It is currently under development by Andrius Sutas, you can browse the SVN repository here.
Examples
Serial
Configuring interface
You might want to configure interface in a loopback mode for testing.
- If you have a Serial adapter, then simply connect pins 3 (Tx) and 2 (Rx) together (assuming your adapter is RS-232 DE9, otherwise check before doing anything). One can also insert an LED in series to view the actual bitstream.
- If you do not have a Serial adapter then create a virtual port using:
# socat PTY,link=/dev/ttyS15 PTY,link=/dev/ttyS16
which will open two interconnected interfaces, where one (e.g. /dev/ttyS15) can be opened in Octave and second (e.g. /dev/ttyS16) using something like GNU screen:
$ screen /dev/ttyS16 <baudrate>
do not forget to change interface permissions if you want to use them with Octave/screen without root privileges.
Parallel
Configuring interface
You will need to load following modules:
# modprobe parport
# modprobe ppdev
Now you should see devices like "/dev/parport0". In case you do not, you will need to create them manually and give sufficient privileges for your user:
# mknod /dev/parport0 c 99 0 -m 666
Example 1: LED trace
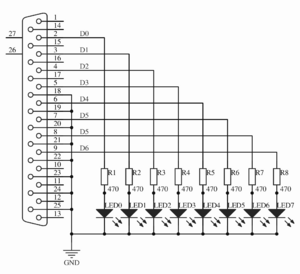
For this example you will need to connect 8 LEDs to Parallel interface Data port as shown below:
And then the actual script:
| Code: trace.m |
delay = 0.1;

pp = parallel("/dev/parport0", 0);
pp_data(pp, 0);

pins = pow2([0, 1, 2, 3, 4, 5, 6, 7]);

while 1
    for p = pins
        pp_data(pp, p);
        sleep(delay);
    endfor

    # Reverse the order
    pins = pins(end:-1:1);
endwhile

pp_close(pp);
|
Run it and you should see LEDs "tracing" forwards and backwards.
Example 2: LED dimming a.k.a. PWM control
Use the same schematic as in Example 1.
| Code: dim.m |
delay = 0.00005;

pp = parallel("/dev/parport0", 0);
pp_data(pp, 0);

dRange = 0:100;
while 1
    for duty = dRange
        pp_data(pp, 255);

        for dOn = 0:duty
            sleep(delay);
        endfor

        pp_data(pp, 0);

        for dOff = 0:(100-duty)
            sleep(delay);
        endfor
    endfor

    # Reverse order
    dRange = dRange(end:-1:1);
endwhile

pp_close(pp);
|
Run it and you should see LEDs changing brightness from lowest to maximum.
Example 3: Logic analyzer
We can surely make something more interesting, right? Enter basic logic analyzer.
Assume you are working with [this] temperature sensor. Something is not right. You do not have one of those expensive logic analyzers, but you do have a Parallel port! You remember that someone made a package for interfacing it with GNU Octave. So you connect your probes to appropriate Data port terminals and change settings accordingly. In this example:
| Probe | Port terminal |
|---|---|
| !CS | DATA0 |
| SCK | DATA1 |
| SO | DATA2 |
NB: Parallel ports usually have weak pull-ups to +5V even when in "input" mode, so do not do this if unsure. One could potentially use different terminals in Control/Status ports to get true high-impedance inputs.
And write a simple script below:
| Code: logic_analyzer.m |
#####################################################################
# Settings
#####################################################################

# Channels to capture
#channels = [0, 1, 2, 3, 4, 5, 6, 7];
channels = [2, 1, 0];

# Channel labels
#channel = {"CH0"; "CH1"; "CH2"; "CH3"; "CH4"; "CH5"; "CH6"; "CH7"};
channel = {"SO"; "SCK"; "!CS"};

# Trigger channel
triggerCh = 0;

# When to trigger
trigger = 0; # Capture on low. For high - 1

#####################################################################

samplesTime = [];
samplesValue = [];

#pp_close(pp);
pp = parallel("/dev/parport0", 1);

printf("Waiting for trigger...\n");
fflush(stdout);

data = pp_data(pp);
while (bitget(data, triggerCh + 1) != trigger)
    oldData = data;
    data = pp_data(pp);
endwhile

printf("Capturing...\n");
fflush(stdout);

startTime = time();
samplesTime(end + 1) = 0;
samplesValue(end + 1) = oldData;

while (bitget(data, triggerCh + 1) == trigger)
    data = pp_data(pp);
    samplesTime(end + 1) = time() - startTime;
    samplesValue(end + 1) = data;
endwhile

# Statistics
printf("Average sample rate: %f kHz\n", size(samplesValue)(2) / samplesTime(end) / 1000.0);

pp_close(pp);

# Plotting

figure;
for p = 1:size(channels)(2)
    subplot (size(channels)(2), 1, p)
    plot(samplesTime, bitget(samplesValue, channels(p) + 1))

    ylabel(channel{p});
    axis([-0.01, samplesTime(end)+ 0.01, -1, 2], "manual");
    set(gca(), 'ytick', -1:2);
    set(gca(), 'yticklabel', {''; '0'; '1'; ''});
endfor
xlabel ("t");
|
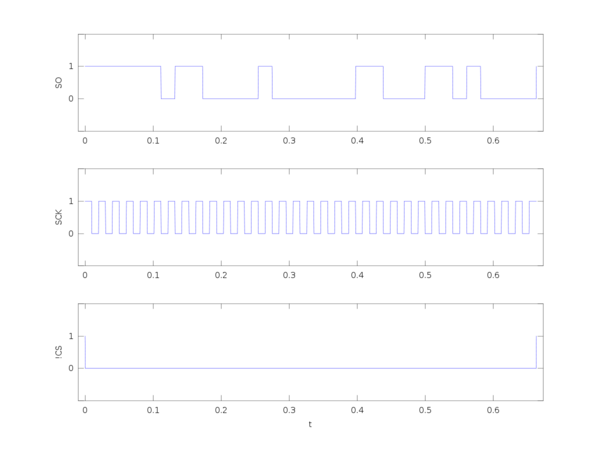
If connections and settings are correct you should see something like this:
Now you can fully debug what is going with your hardware from comfort of GNU Octave.
i2c
i2c

