Uicontrols
Jump to navigation
Jump to search
uicontrols: Build a GUI in GNU Octave
You have to use the "qt" graphics toolkit (default since 4.0). For the best results GNU Octave version >= 4.2.x should be used.
Example 1: imageViewer
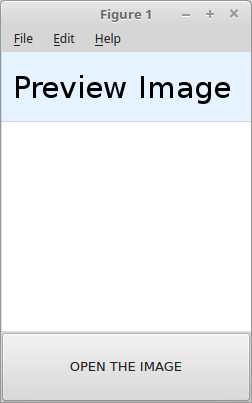
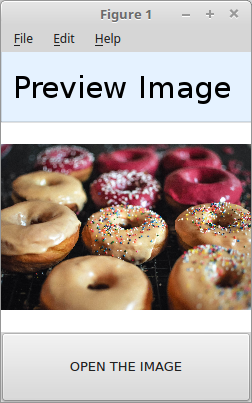
GUI which opens a file selection dialog when a button is pressed and views the selected image.
| Code: imageViewer example |
%% In file 'imageViewer.m'
function imageViewer ()
  MainFrm = figure ( ...
    'position', [100, 100, 250, 350]);

  TitleFrm = axes ( ...
    'position', [0, 0.8, 1, 0.2], ...
    'color',    [0.9, 0.95, 1], ...
    'xtick',    [], ...
    'ytick',    [], ...
    'xlim',     [0, 1], ...
    'ylim',     [0, 1] );

  Title = text (0.05, 0.5, 'Preview Image', 'fontsize', 30);

  ImgFrm = axes ( ...
    'position', [0, 0.2, 1, 0.6], ...
    'xtick',    [], ...
    'ytick',    [], ...
    'xlim',     [0, 1], ...
    'ylim',     [0, 1]);

  ButtonFrm = uicontrol (MainFrm, ...
    'style',    'pushbutton', ...
    'string',   'OPEN THE IMAGE', ...
    'units',    'normalized', ...
    'position', [0, 0, 1, 0.2], ...
    'callback', { @previewImage, ImgFrm });
end

%% callback subfunction (in same file)
function previewImage (hObject, eventdata, ImageFrame)
  [fname, fpath] = uigetfile();
  Img = imread (fullfile(fpath, fname));
  axes(ImageFrame);
  imshow(Img, []);
  axis image off
end
|
Then run imageViewer() from your terminal:
Example 2: demo_uicontrol
This example tries to show all available uicontrols (needs Octave >= 4.0 and qt):
| Code: demo_uicontrol.m |
## 20.03.2017 Andreas Weber <andy@josoansi.de>
## Demo which has the aim to show all available GUI elements.
## Useful since Octave 4.0

close all
clear h

graphics_toolkit qt

h.ax = axes ("position", [0.05 0.42 0.5 0.5]);
h.fcn = @(x) polyval([-0.1 0.5 3 0], x);

function update_plot (obj, init = false)

  ## gcbo holds the handle of the control
  h = guidata (obj);
  replot = false;
  recalc = false;
  switch (gcbo)
    case {h.print_pushbutton}
      fn =  uiputfile ("*.png");
      print (fn);
    case {h.grid_checkbox}
      v = get (gcbo, "value");
      grid (merge (v, "on", "off"));
    case {h.minor_grid_toggle}
      v = get (gcbo, "value");
      grid ("minor", merge (v, "on", "off"));
    case {h.plot_title_edit}
      v = get (gcbo, "string");
      set (get (h.ax, "title"), "string", v);
    case {h.linecolor_radio_blue}
      set (h.linecolor_radio_red, "value", 0);
      replot = true;
    case {h.linecolor_radio_red}
      set (h.linecolor_radio_blue, "value", 0);
      replot = true;
    case {h.linestyle_popup, h.markerstyle_list}
      replot = true;
    case {h.noise_slider}
      recalc = true;
  endswitch

  if (recalc || init)
    x = linspace (-4, 9);
    noise = get (h.noise_slider, "value");
    set (h.noise_label, "string", sprintf ("Noise: %.1f%%", noise * 100));
    y = h.fcn (x) + 5 * noise * randn (size (x));
    if (init)
      h.plot = plot (x, y, "b");
      guidata (obj, h);
    else
      set (h.plot, "ydata", y);
    endif
  endif

  if (replot)
    cb_red = get (h.linecolor_radio_red, "value");
    lstyle = get (h.linestyle_popup, "string"){get (h.linestyle_popup, "value")};
    lstyle = strtrim (lstyle(1:2));

    mstyle = get (h.markerstyle_list, "string"){get (h.markerstyle_list, "value")};
    if (strfind (mstyle, "none"))
      mstyle = "none";
    else
      mstyle = mstyle(2);
    endif

    set (h.plot, "color", merge (cb_red, [1 0 0 ], [0 0 1]),
                 "linestyle", lstyle,
                 "marker", mstyle);
  endif

endfunction


## plot title
h.plot_title_label = uicontrol ("style", "text",
                                "units", "normalized",
                                "string", "plot title: (text)",
                                "horizontalalignment", "left",
                                "position", [0.6 0.85 0.35 0.08]);

h.plot_title_edit = uicontrol ("style", "edit",
                               "units", "normalized",
                               "string", "Please fill me! (edit)",
                               "callback", @update_plot,
                               "position", [0.6 0.80 0.35 0.06]);

## grid
h.grid_checkbox = uicontrol ("style", "checkbox",
                             "units", "normalized",
                             "string", "show grid\n(checkbox)",
                             "value", 0,
                             "callback", @update_plot,
                             "position", [0.6 0.65 0.35 0.09]);

h.minor_grid_toggle = uicontrol ("style", "togglebutton",
                                 "units", "normalized",
                                 "string", "minor\n(togglebutton)",
                                 "callback", @update_plot,
                                 "value", 0,
                                 "position", [0.77 0.65 0.18 0.09]);

## print figure
h.print_pushbutton = uicontrol ("style", "pushbutton",
                                "units", "normalized",
                                "string", "print plot\n(pushbutton)",
                                "callback", @update_plot,
                                "position", [0.6 0.45 0.35 0.09]);
## noise
h.noise_label = uicontrol ("style", "text",
                           "units", "normalized",
                           "string", "Noise:",
                           "horizontalalignment", "left",
                           "position", [0.05 0.3 0.35 0.08]);

h.noise_slider = uicontrol ("style", "slider",
                            "units", "normalized",
                            "string", "slider",
                            "callback", @update_plot,
                            "value", 0.4,
                            "position", [0.05 0.25 0.35 0.06]);

## linecolor
h.linecolor_label = uicontrol ("style", "text",
                               "units", "normalized",
                               "string", "Linecolor:",
                               "horizontalalignment", "left",
                               "position", [0.05 0.12 0.35 0.08]);

h.linecolor_radio_blue = uicontrol ("style", "radiobutton",
                                    "units", "normalized",
                                    "string", "blue",
                                    "callback", @update_plot,
                                    "position", [0.05 0.08 0.15 0.04]);

h.linecolor_radio_red = uicontrol ("style", "radiobutton",
                                   "units", "normalized",
                                   "string", "red",
                                   "callback", @update_plot,
                                   "value", 0,
                                   "position", [0.05 0.02 0.15 0.04]);

## linestyle
h.linestyle_label = uicontrol ("style", "text",
                               "units", "normalized",
                               "string", "Linestyle:",
                               "horizontalalignment", "left",
                               "position", [0.25 0.12 0.35 0.08]);

h.linestyle_popup = uicontrol ("style", "popupmenu",
                               "units", "normalized",
                               "string", {"-  solid lines",
                                          "-- dashed lines",
                                          ":  dotted lines",
                                          "-. dash-dotted lines"},
                               "callback", @update_plot,
                               "position", [0.25 0.05 0.3 0.06]);

## markerstyle
h.markerstyle_label = uicontrol ("style", "text",
                                 "units", "normalized",
                                 "string", "Marker style:",
                                 "horizontalalignment", "left",
                                 "position", [0.58 0.3 0.35 0.08]);

h.markerstyle_list = uicontrol ("style", "listbox",
                                "units", "normalized",
                                "string", {"none",
                                           "'+' crosshair",
                                           "'o'  circle",
                                           "'*'  star",
                                           "'.'  point",
                                           "'x'  cross",
                                           "'s'  square",
                                           "'d'  diamond",
                                           "'^'  upward-facing triangle",
                                           "'v'  downward-facing triangle",
                                           "'>'  right-facing triangle",
                                           "'<'  left-facing triangle",
                                           "'p'  pentagram",
                                           "'h'  hexagram"},
                                "callback", @update_plot,
                                "position", [0.58 0.04 0.38 0.26]);

set (gcf, "color", get(0, "defaultuicontrolbackgroundcolor"))
guidata (gcf, h)
update_plot (gcf, true);
|

